Just like stories, pictures can be powerful in giving us a new way to look at the world. And as the number of stories on Patient Opinion goes up and up, we need to give you new ways to get an overview of people's experiences, and explore the stories where those experiences are shared.
Recently we've added some new visualisations to Patient Opinion to do just that. We were inspired by the great work of Shaun Maher and Tim Norwood in the Person-Centred Care team in the Scottish Government, who are exploring the value of Patient Opinion with clinical teams.
Tag bubbles
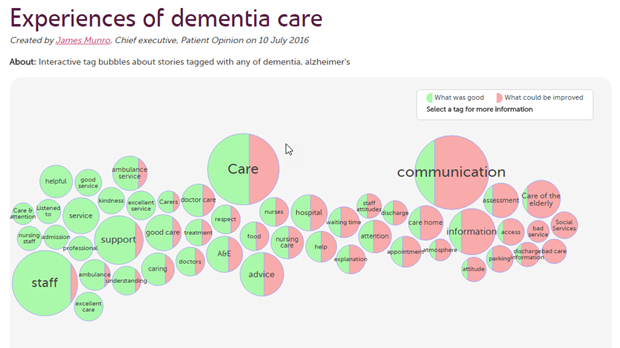
Our tag bubble visualisation gives you an informative overview of the aspects of care people are tagging in their stories as "what was good" or "what could be better".
By clicking on a bubble, you can navigate to the stories which inform it. The visualisation is interactive, so it is best to explore one live, like this one on experiences of dementia care. (You'll need a modern browser.)
Here's a non-interactive picture of how tag bubbles look:
Tag word clouds
A while back we added "story word clouds" to our visualisations, and now we have "tag word clouds". What's the difference?
Simple: story word clouds are created from the words people are using in their stories. On the other hand, tag clouds are created from the tags people are using to describe their stories. When posting, authors can add tags specifically for what was good, what could be better? and how did you feel? The tag cloud visualisation allows you select any of those categories for your cloud.
So how do I do this?
To create a visualisation, you need to be logged into your subscription. Note that visualisations are not available on our starter level.
Then you
1. Make a search, as usual, for the stories you want in your visualisation. (You can visualise any search you want to create.)
2. Select "Save my search as".
3. Select the visualisations tab, and choose the visualisation you want.
Not too hard!
Two more important things to say
I know, you want to go and give it a try! Just two more things before you go.
When you first create your visualisation, it is a preview - you can't share it with others. If you want to share it, give it a name and publish it. Then you will have a link which you can send to anyone you like.
You can find your list of saved visualisations in your Saved Things page.
Secondly, bear in mind that once you publish a visualisation, the data is a snapshot and will not be updated over time. So if you want to compare your tag bubbles now and next year, you'll need to create one now, another in a years time, and compare the two.
Hope that helps! Post a response if you have any questions.
New tag bubbles and clouds
New tag bubbles and clouds https://www.careopinion.org.uk/resources/blog-resources/27-images/1f2b6e1b62d9415da58304c01f5dffda.png Care Opinion 0114 281 6256 https://www.careopinion.org.uk /content/uk/logos/co-header-logo-2020-default.pngUpdate from Care Opinion tech
Posted by James Munro, Chief executive, Care Opinion, on
Thanks for your feedback.


